How and why to use the VIX to see an upcoming change in market trends, the «fear index» about implied volatility of options on S&P 500.

Which gauge do you use to understand a change in a market trend? I don’t want to talk about 200dd moving averadge or MACD or other tools like these.
I want to talk about a real index that helps me to understand where the markets are going: The first “fear index” is VIX.
VIX is the implied volatility of options on S&P 500 index. The implied volatility is not the future volatility of the index. It is the expected volatility investors are buying when they go long on options on S&P 500 index.
The VIX is a very useful guide to the expectation of significant change in the market. There are times, such on August 24th, but also on September 14th, when the source of the fear can be easily identified.
In August, VIX climbed in a reaction to expectations of FED’s hyke and, most important, in a reaction to yuan’s devaluation and fears of China‘s hard landing.
(See the table below.)
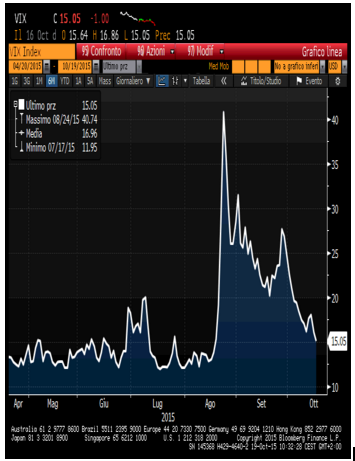
VIX INDEX FROM APRIL TO OCTOBER 2015
But the rapid decline of VIX in September was a clear message that Janet Yellen would not raise interest rates at the FOMC meeting.
So the understanding of the VIX can help you to understand the upcoming change in a market’s trend.
The key words are «expectation of volatility». It says nothing about the future direction of said volatility. It says all about what investor expect from the markets in weeks to come. High VIX readings can be associated with both bullish and bearish conditions. But, as a measure of expected future volatility, the higher readings tell us that traders are anticipating an increase in market volatility, which is usually associated with a trend change.
The VIX by itself is not particularly useful. But combine the VIX with other chart analysis methods and the trader has a good idea of the direction of the volatility move i.e. it tells the trader about the direction of the trend change, or trend acceleration.
If I am long on equity and the market is showing some signs of end-of-trend behavior and the VIX gives a high reading, then I need to be fearful (see below). It will be better to sell.
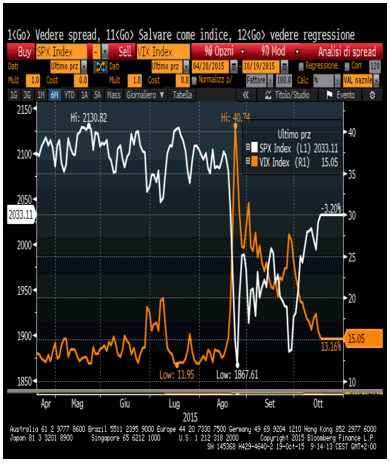
CORRELATION BETWEEN VIX (YELLOW) AND SP500 INDEX (WHITE)
More recently, this takes us back to the recent VIX chart in September which showed a dramatic decline in the VIX reading. What had the market been afraid of that drove the VIX to the previous highs? The upcoming FOMC meeting and the potential for an interest rate rise was the primary fear in the market.
Secondly, after August 11st decision by chinese authorities to devaluate the renmimbi, market’s fear was that an upcoming hard landing of China’s economy could bring global economy in recession in 2016.
There was a high expectation of volatility and the consequent potential for a trend change or acceleration. Then, suddenly the VIX dropped. This gave a clear indication that the market did not expect a rise in interest rates. It expected the situation to remain unchanged. Secondly, the VIX dropped because fears of a hard landing in China disappeared.
There was no need for volatility to rise and more need for investors to anticipate a significant potential for trend change. The VIX indicator gave traders the answer on what the Fed’s move would be long before it became reality. The VIX, used properly, assists traders to anticipate the potential for significant trend change.
Combined with other chart analysis methods it provides a significant trading edge, which is nothing to be fearful of.
You can trade VIX throu derivatives (VIX futures are traded monthly at Chicago Board Option Exchange ) or, more simply, throu ETF’s listed in European stock exchanges (for example in Milan Stock Exchange you will find LVO ticker, that will help you hedging against SP500 bear trend as you can see on the table below).
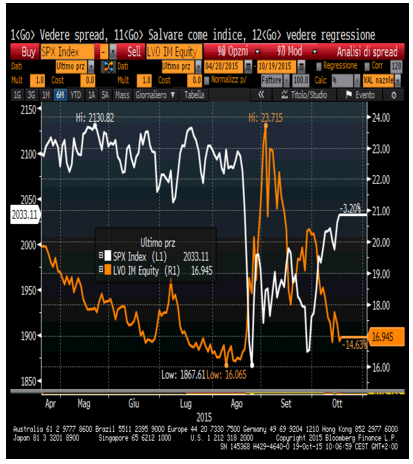
CORRELATION BETWEEN LVO IM (YELLOW) AND SP500 INDEX (WHITE)
Argomenti

