
So, we have seen a sell-off this week, before Thanksgiving day, and both the SP500 and DAX were under pressure. Commodities and oil prices fell due to unfavourable China data and crude inventories.
The index slid below 2,064, its 200-day moving average. But this sell-off was something due. During the month of October we had a nice move off those lows of August 24th and September 28th.
This summer we had a pretty good sell-off in high-yield bonds. The july Greece crisis, the Yuan’s devaluation and finally VW’s diesel gate drove up the volatility in equities, and also drove up those yields and spreads over the benchmark curve.
But now, starting from October, we have seen a tightening of corporate bond spreads and a return of liquidity on the market, with a lot of new issues in the primary market, especially in the euro area industrial sector. This is a good sign of optimism to me.
Many people think the market is going from bending to broken.
I don’t think so. Up to now, we just had a controlled pullback, and not a reversal of the long term bull market.
But the question is: does it get deeper? And will take away hopes of new highs in the S&P before year-end?
I think the answer is NO. We have just retraced about a third of the move (off September lows) which has been deemed healthy. And that gives hope to investors this is only a short-term bull market correction.
The bulls will not lose their confidence.
The only very big issue are Oil and Commodities. Stay away from these assets.
West Texas Intermediate is down 2.6 percent Thursday at $41.80 per barrel, and has fallen more than 7.5 percent in the past week.
Oil has become a headwind. It could get very uncomfortable if it happens to break $40, and that could happen with negative data coming from China and crude inventories.
Also Copper is going down to new lows and we actually don’t know where’s the bottom.
The VIX index, which went over 17 Thursday, has been rebounding from an Oct. 28 test of 12. But actually did not go above 20. Historically, level 12 also is associated with peaks in the S&P 500 over the past two years.
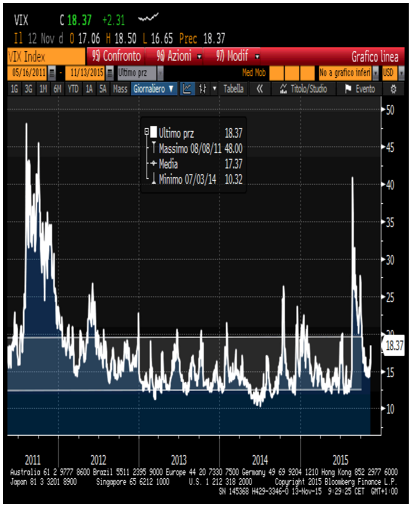
VIX index 2011-2015
Next level to watch on the S&P is 2,021, the intermediary high between the two bottoms set Aug. 24 and Sept 29. This level will be a logical place to have a stall of the recent pullback, and would be a strong buy opportunity. Let’s say we hypothetically get back down to 2021 level: don’t worry. Those are levels that are the most obvious on the charts.
I think what investors need to do is take the market’s temperature as we hit those levels, and start buying. Liquidity is the best asset now for a balanced portfolio. But be ready to buy, until the end of this short-term pullback. The “green light” for buying stocks will be the day when VIX index will go down below 16.
This is a normal and healthy correction, a bull market correction to me. After that, the market could then be setting up for a year-end Santa Claus rally.
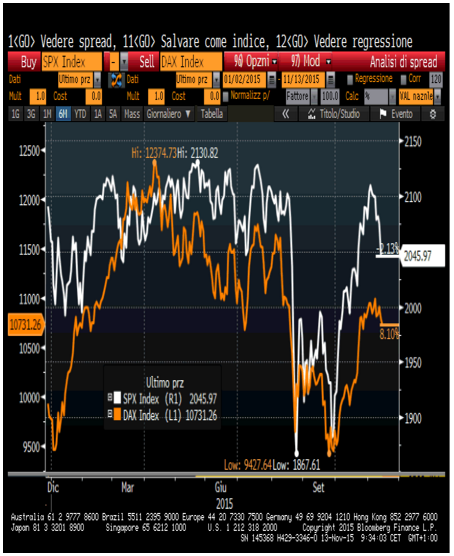
Correlation between SP500 e DAX 30
Whatever pullback we get out of here, I’m looking for a buying opportunity. Kellogg’s, Visa, Henkel, Siemens, Basf, Bayer, Banca Intesa will be my best picks. The Fed shouldn’t be an issue for the market if it raises rates on Dec. 16 because the economy appears strong enough to handle it.
At the same time the ECB will announce the second round of QE in December, and that will be another positive momentum, especially for European Stocks. By year-end, we could challenge or exceed the 2015 highs on the S&P 500. Seasonally, the strongest month of the year is December.
© RIPRODUZIONE RISERVATA

